Jupyter Integration
Datapane has first-class Jupyter Notebook support. This includes Jupyter Lab, Jupyter Notebook, Google Colab, and Visual Studio Code with the Jupyter plugin.
Let's see how Datapane and Jupyter Notebook can build data-powered apps, all without disrupting your workflow.
That's not bad, but it could be much better. Let's wrap our DataFrame in Datapane's dp.DataTable block and see what happens.
Our DataFrame is now interactive. We can explore it with filters, sorting, export options, and even run SQL queries against the data.
Adding structure with Tabs
Notebooks don't have to be a flood of in/out cells that are viewed from top to bottom. We can add depth to our notebooks with tabs.
Let's create a scatter plot with our dataset from earlier...
... and bring them both together with a dp.Select block.
Convert Notebooks to Reports
Data analysis often begins in a Jupyter Notebook, and once complete, we need to share our insights.
Some recipients may be comfortable with an .ipynb file, and in those instances, you could just send your notebook over and still benefit from Datapane's enhancements.
But in most cases, you will want to turn your notebook into something presentable and accessible. With Datapane, all it takes is a single line of code.
Datapane will automatically detect your cells and convert them to a set of blocks which can be saved as a report.

Opt-in or opt-out
By default, notebook-to-report conversion will include all markdown and supported cell output. This is the easiest and quickest way to turn your notebook into an report.
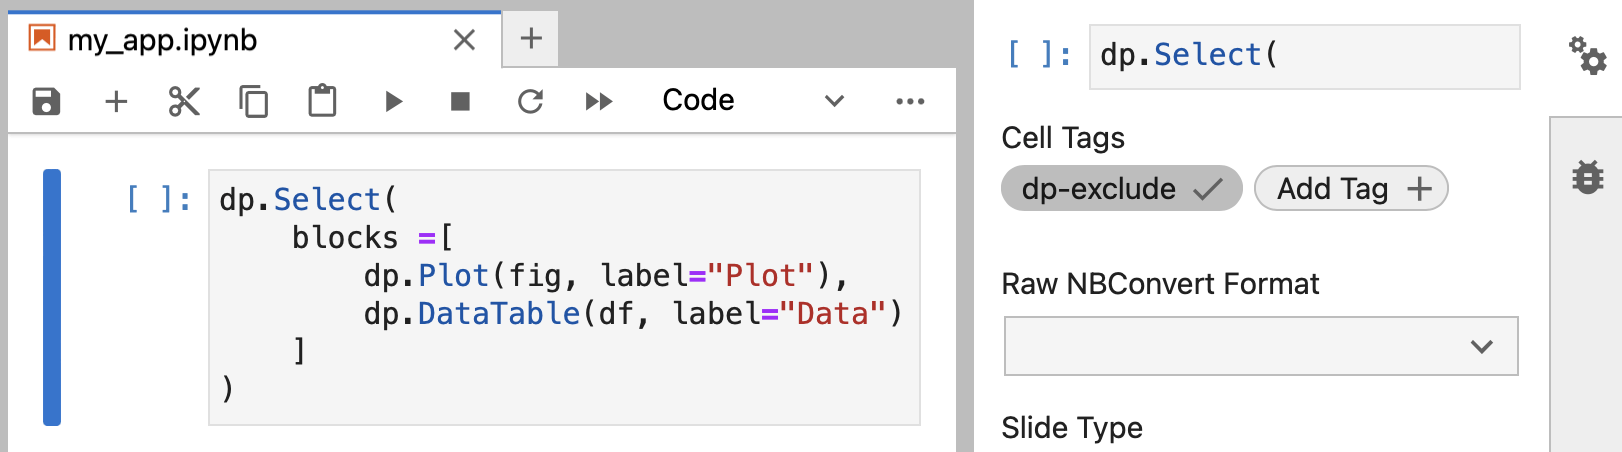
In this mode, you can explicitly exclude cells with the cell tag dp-exclude.
In some cases, it is preferable to only include cells of interest. This can be achieved by setting opt_out to False, e.g.:
In this mode, you can explicitly include supported cells with the cell tag dp-include.

Display input code
You may want to display the input code for a particular cell in your report. Datapane has you covered. You can include code cells with the cell tag dp-show-code.
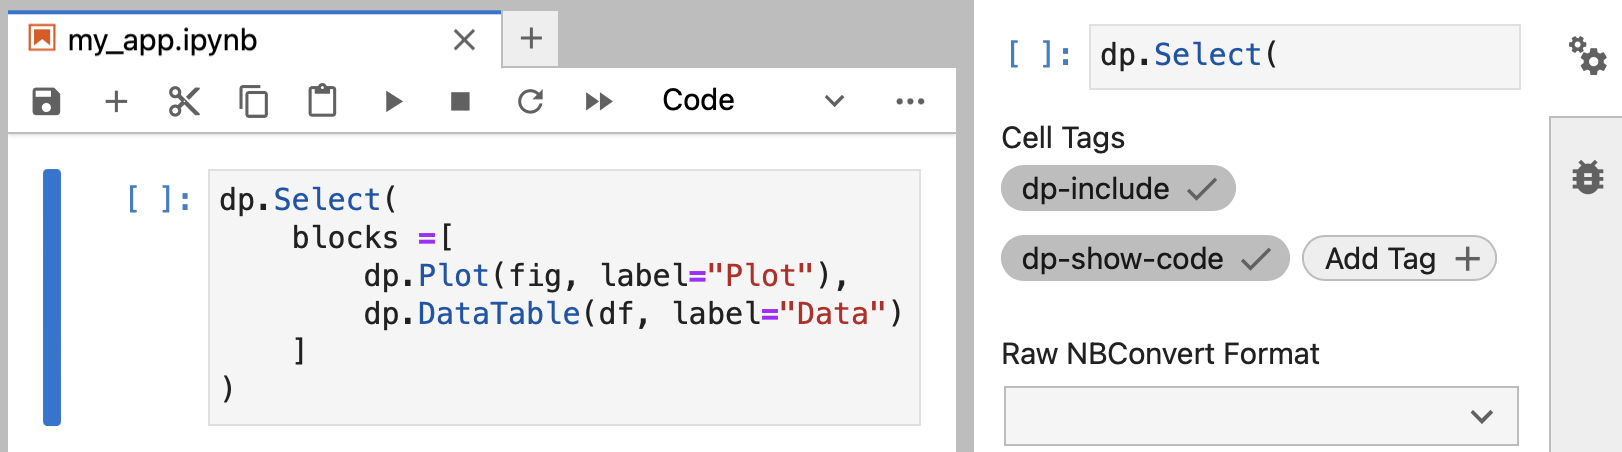
Let's do this for the cell below: